|
|
 
|
|

|
|
|
||||
|
|
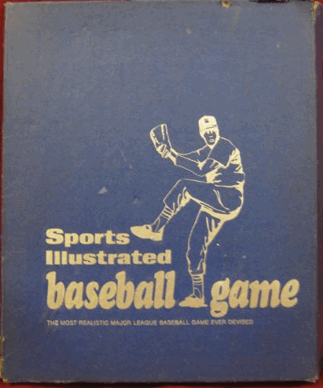
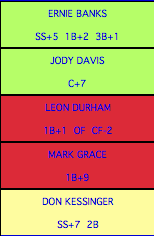
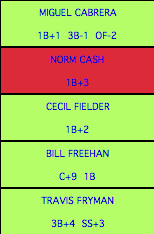
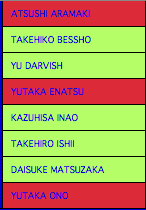
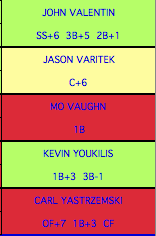
The Global All-Time All-Stars are a collection of 50 teams, of 25 players each, designed in the traditional SIBB manner. Nearly every professional baseball team is represented, from 1876 to 2012, including Japanese teams, Negro Leagues, and now long-defunct 19th century teams ~ any players for whom statistics could be found. Click here to return to the main page. Download the entire package of teams and era charts. Why 50 teams? Elegance and competitive balance. Specifically, this allowed the relocated franchises of the 1950s to have distinct teams, e.g. the Brooklyn Dodgers are one team, and the Los Angeles Dodgers are another. By breaking up the original 16 teams into two squads, you also allow the expansion teams to compete against them on a reasonable footing ~ all teams draw their players from about 50 years worth of seasons.
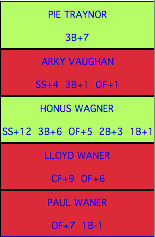
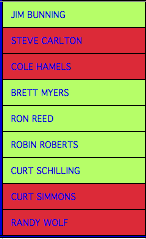
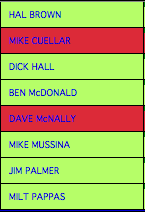
Did you normalize? Absolutely, using routines I've been refining specially for SIBB play for almost 20 years. That said, in the thousands of hours I've spent doing this, I've come to believe that normalizing baseball stats is composed in equal parts of both hard, quantifiable stats, and artistic decisions. These teams are normalized for era of play: you'll see Deadball-era sluggers like Cravath hit 'em out like A-Rod. But I did not normalize for ballparks ~ after a lot of research on this, I'm not convinced that doing so is defensible statistically. And besides, the goal here is to field 50 competitive teams. If a team's batters benefitted from a short porch, then their pitchers suffered from it, and that should more or less balance out. (I'm also convinced that ballplayers adjust their game to their environment more than we give them credit for, but that's another story.) What does this cost? Will printed charts be available? You can download the 50 teams for free. As for printing charts: maybe. When you download, I'm going to ask you whether or not you'd be interested in purchasing printed charts. It isn't cheap to print, so I will do so only if we have sufficient interest. Will it be available for the SIBB computer game? I will be delighted to give these to Richard Dombrovski so that they can be included in his excellent SIBB computer game. If anyone wants to volunteer some time to help re-format my excel charts to fit Richard's needs, please email me. Why team charts instead of player cards? A very significant part of the attraction of this game for me is the colorful team charts. To me, this is art. Anyone who wants to convert these into individual player cards can email me and I'll be happy to provide assistance. (PS: does anyone ever make colorful player cards? I'd like those a lot more!) Other tidbits: 1. All player ratings are based on the stats from the player's entire career. |
|
|
|
|
||||

|
|
I hope you'll find this a fun addition, and increase your enjoyment of SIBB baseball. Please feel free to email me, Dave LeLacheur with any questions, comments, or arguments for players who should have been on your favorite team. I've been remaking SI baseball charts ever since discovering a 1-2-3 spreadsheet in 1994, and welcome the debate. © 2013, Dave LeLacheur. All rights reserved.  |
|

|
